|
Results and Data Analysis
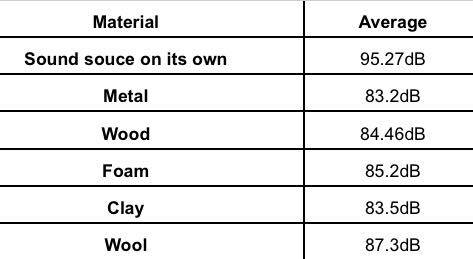
The chart on the right displays the average intensities of sound waves that passed through each material. The average of the intensities of sound waves was found after averaging all three trials for each material. |
|
|
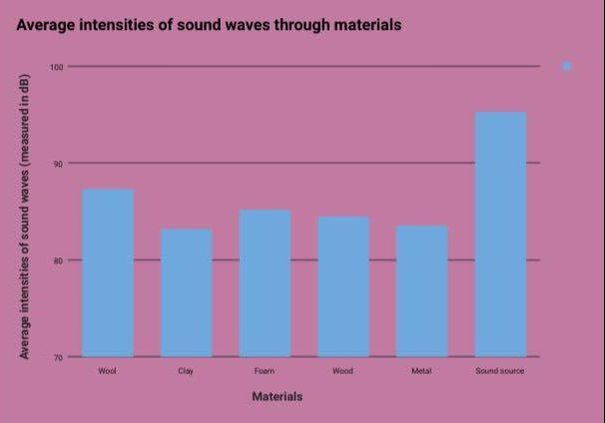
The bar graph on the right also displays the average intensities of sound waves through each material.
The sound source on its own has an obvious lowest intensity loss because there was no material between the sound source and the decibel meter. The measurement of loss of sound wave intensity of the metal and clay were most similar at 83.2 and 83.5 decibels respectively. However, the sound waves through the metal showed the greatest loss in intensity. The level of intensity of the sound waves passing through the wood and foam was relatively similar with the wood transmitting less sound. The sound passing through the wool lost the least intensity. |
|
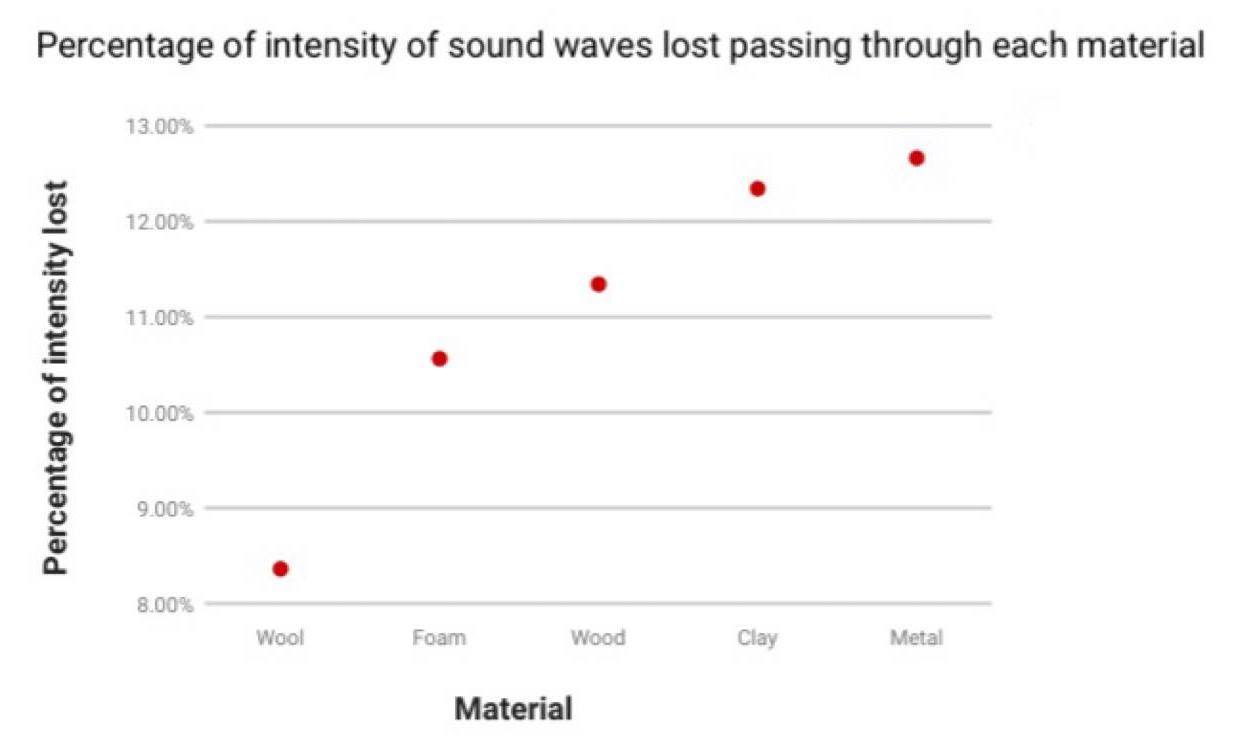
To find the average percentages of intensity of sound waves lost in passing through each material, the average intensity of the sound waves through each material was subtracted from the average intensity of the sound source. That result was then divided by the intensity of the sound source to find the average percentage of intensity of sound waves lost.
|
The graph on the left shows the average percentages of the loss of sound intensity passing through each material. The metal shows the highest percentage, reaching almost 13% of intensity lost. The wool shows the lowest percentage, reaching only 8% of intensity lost. The wood and foam show less intensity lost than the clay, at 1% and 2% respectively. |
|
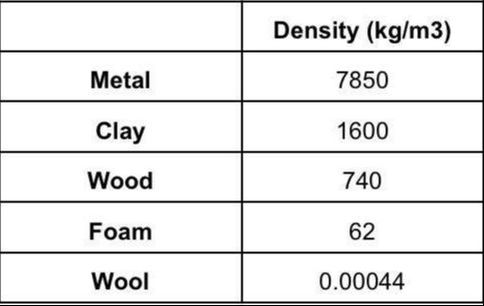
The chart on the right shows the densities of the various materials used in the experiment; this supports the hypothesis. Due to the fact that the materials have such a significant range of densities, it was not possible to make an accurate graph. |
|
This experiment is proven to be reliable due to the fact that the results in all three trials remained within a range of 2 decibels. This indicates that the project is consistent. Also, the average of the three trials for each material was the same as one of the trial results for that material.
